


CFOs track dozens of key performance indicators to assess their company’s financial health: gross profit margin shows pricing power, net profit margin reveals bottom-line efficiency, operating cash flow and free cash flow measure liquidity, while debt to equity ratio and interest coverage ratio signal financial stability. These metrics paint the big picture, but they’re lagging indicators—by the time net income drops or cash flow deteriorates, the damage is already done.
The metrics that give you early warning signs and direct levers for improvement are credit and risk management KPIs: Days Sales Outstanding (DSO), bad debt ratio, Collection Effectiveness Index, cash conversion cycle, working capital, and accounts receivable turnover. These aren’t just finance team scorecards—they’re operational metrics that directly influence how fast cash flows into your business, how much revenue you actually keep, and whether your growth is sustainable or burning through working capital.
This guide breaks down the six credit and risk metrics every CFO should track, explains how to calculate each one, and shows how automation through platforms like Kolleno helps maintain and improve them without adding manual effort or headcount.
1. Days Sales Outstanding (DSO)
Days Sales Outstanding measures the average number of days it takes your business to collect payment after a sale is made. It’s one of the most critical metrics for understanding how efficiently your accounts receivable processes convert invoices into cash.
Lower DSO means cash is flowing into your business faster, improving your working capital and reducing the need for external financing. For finance leaders, DSO is a direct indicator of credit management effectiveness and collection performance—if DSO is climbing, it signals either customers are paying slower, credit policies are too lenient, or your collection processes need tightening.
How to Calculate DSO
DSO = (Accounts Receivable ÷ Total Credit Sales) × Number of Days
How Automation Helps
Kolleno automates payment reminders based on customer risk profiles and accelerates cash application so payments post to accounts receivable immediately rather than sitting in queues for manual processing. This combination typically cuts 3-7 days off DSO by ensuring timely collections and real-time financial data. The platform also surfaces which customers are consistently slow payers, allowing you to adjust credit terms proactively before DSO climbs.
2. Bad Debt Ratio
Bad debt ratio measures the percentage of your accounts receivable that becomes uncollectible and must be written off. This metric directly impacts your net income and reveals how well your credit risk management and collection processes are protecting revenue.
A rising bad debt ratio signals problems in credit assessment, inadequate monitoring of customer financial health, or ineffective collection strategies that let receivables age beyond recovery. For CFOs, bad debt ratio is a key indicator of both credit policy effectiveness and the financial risks building in your customer base—every percentage point increase represents revenue that hit your books but never reached your cash position.
This lost revenue flows straight through to reduced net income and compressed net profit margin, making bad debt one of the most direct threats to your company’s financial performance.
How to Calculate Bad Debt Ratio
Bad Debt Ratio = (Bad Debt Written Off ÷ Total Credit Sales) × 100
How Automation Helps
Kolleno continuously monitors customer payment behavior and sends real-time alerts when customers show early warning signs of financial difficulty, allowing you to adjust credit limits or intensify collections before accounts become uncollectible. Automated collections workflows ensure no invoice falls through the cracks with systematic follow-up based on configurable rules. Integration with external credit agencies helps you make informed credit decisions upfront, preventing bad debt before it happens.
3. Collection Effectiveness Index (CEI)
Collection Effectiveness Index measures how effectively your AR team collects outstanding receivables during a given period. Unlike DSO, which can be influenced by sales timing and credit terms, CEI focuses specifically on your collection team’s performance in converting receivables into cash. A CEI of 100% means you collected every dollar that was collectible during the period—in practice, scores above 85% are considered excellent. This metric helps finance leaders understand whether slow collections are due to team effectiveness, process efficiency, or external factors like customer financial difficulties. CEI is particularly valuable for identifying whether investments in collection tools or process changes are actually improving operational efficiency.
How to Calculate CEI
CEI = [(Beginning Receivables + Credit Sales – Ending Receivables) ÷ (Beginning Receivables + Credit Sales – Current Receivables)] × 100
How Automation Helps
Kolleno’s AI-driven prioritization surfaces accounts needing immediate attention based on amount, risk, and days overdue, so collectors focus on high-value cases while automated reminders handle routine follow-up for low-risk accounts. This combination means your team’s limited hours go toward complex negotiations and relationship management rather than repetitive tasks. Companies using Kolleno typically see CEI improvements of 10-15 percentage points as automation removes manual effort limitations.
4. Cash Conversion Cycle (CCC)
Cash Conversion Cycle measures how long it takes your business to convert investments in inventory and other resources into cash from sales. It combines three key components: how long inventory sits before being sold, how long it takes to collect payment from customers (DSO), and how long you take to pay suppliers (DPO).
A shorter CCC means cash flows through your business faster, reducing the need for external financing and improving your cash position. A tighter CCC improves operating cash flow and free cash flow, giving you more resources for business growth and reducing dependence on external financing.
For finance leaders, CCC reveals the efficiency of your entire working capital management—from procurement to collections—and highlights where cash is getting tied up in business operations.
How to Calculate CCC
CCC = Days Inventory Outstanding (DIO) + Days Sales Outstanding (DSO) – Days Payable Outstanding (DPO)
How Automation Helps
Kolleno directly impacts the DSO component of your cash conversion cycle by accelerating collections through automated reminders, faster cash application, and proactive customer engagement. By reducing the time between invoicing and payment collection, the platform shortens your overall CCC and frees up working capital. Real-time visibility into payment behavior also helps you identify which customers are extending your cycle unnecessarily, allowing you to adjust payment terms or collection intensity to protect your cash flow management.
5. Working Capital
Working Capital measures your company’s ability to meet short term obligations and fund day-to-day business operations. It represents the difference between current assets (cash, accounts receivable, inventory) and current liabilities (accounts payable, short-term debt, accrued expenses).
Positive working capital means you have enough liquid assets to cover immediate obligations; negative working capital signals potential liquidity problems. For CFOs, working capital is a fundamental indicator of operational efficiency and financial health—too little threatens your ability to operate smoothly, while too much suggests capital isn’t being deployed productively for business growth.
How to Calculate
Working Capital = Current Assets – Current Liabilities
How Automation Helps
Kolleno improves working capital by accelerating the conversion of accounts receivable (a current asset) into cash. Faster collections through automated reminders and workflows mean less capital is tied up in outstanding invoices, improving your liquidity without requiring additional external financing. The platform’s dispute management also prevents revenue from sitting frozen in disputed status, ensuring receivables convert to cash rather than aging indefinitely.
Better working capital management through automation gives you more flexibility for strategic initiatives and reduces reliance on credit lines. Strong working capital management also protects cash runway during slower periods and improves your ability to meet cash obligations without tapping debt, which in turn supports better interest coverage ratios and debt to equity ratios.
6. Accounts Receivable Turnover
Accounts Receivable Turnover measures how many times per year your business collects its average receivables balance—essentially, how efficiently you’re converting credit sales into cash. A higher turnover ratio indicates you’re collecting payments quickly and managing credit effectively; a lower ratio suggests slow collections, overly lenient credit terms, or customer payment issues.
This metric helps finance leaders assess whether credit policies and collection processes are appropriately balanced for the business—too strict and you lose sales, too loose and you tie up working capital in slow-paying customers. AR turnover is particularly useful for comparing performance across periods or against industry benchmarks.
How to Calculate
AR Turnover = Net Credit Sales ÷ Average Accounts Receivable
How Automation Helps
Kolleno increases AR turnover by ensuring receivables are collected faster and more consistently. Automated collections workflows reduce the time invoices spend outstanding, while faster cash application means receivables are cleared from your books as soon as payment arrives rather than lingering while finance teams process them manually. By improving collection effectiveness and reducing aging, Kolleno helps you turn over your receivables more frequently—directly improving this key metric and the operational efficiency it represents.
How Kolleno Transforms Credit & Risk Management
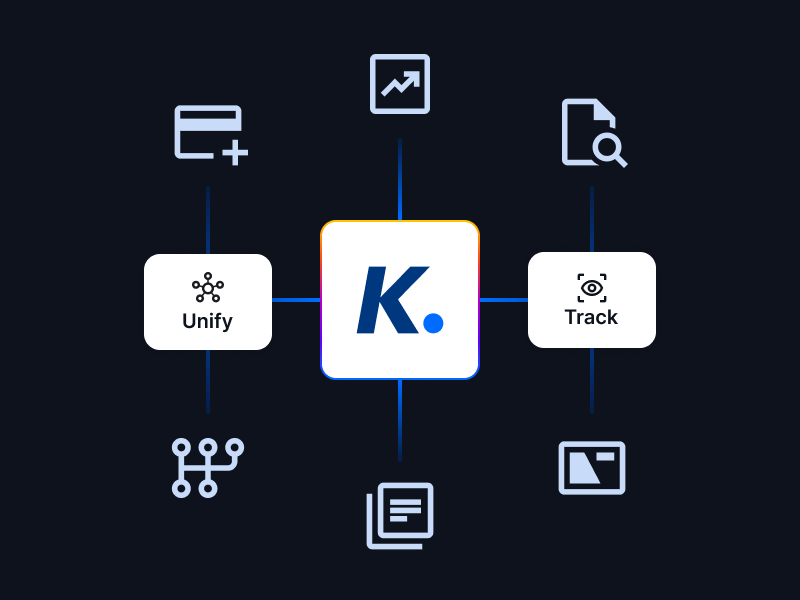
Kolleno doesn’t just help you track these metrics—it actively improves them by automating the workflows that drive credit and risk performance. The platform centralizes credit monitoring, collections, cash application, and dispute management in one system that connects directly to your ERP system and payment processors. Instead of finance teams manually compiling data from multiple sources to calculate DSO, bad debt ratios, or working capital positions, Kolleno provides real-time dashboards that show exactly where your credit and risk metrics stand and which accounts are moving them in the wrong direction.
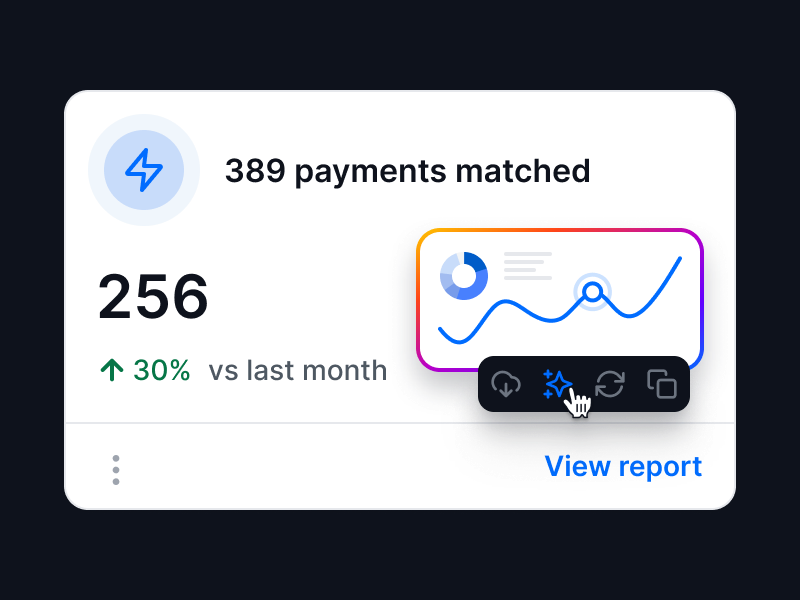
The automation impact shows up across every metric covered in this guide. Real-time credit alerts catch payment behavior changes before they become bad debt. AI-driven collections improves Collection Effectiveness Index by ensuring your team focuses on high-impact accounts. Automated reminders and faster cash application directly reduce Days Sales Outstanding and improve accounts receivable turnover. Dispute management prevents revenue from sitting frozen in contested status, protecting both working capital and cash conversion cycle. This isn’t theoretical—companies using Kolleno see measurable improvements in these key metrics within quarters, not years.
Most importantly, Kolleno scales with your business operations without requiring proportional increases in finance team headcount. The same automation that handles 100 customers efficiently handles 1,000 customers efficiently, maintaining healthy credit and risk metrics even as transaction volumes grow. For finance leaders balancing business growth with financial stability, that scalability is what transforms credit risk management from a constant firefight into a competitive advantage that actually supports revenue growth rather than limiting it.
Final Thoughts
Credit and risk management metrics aren’t just numbers for monthly reporting—they’re early warning systems that reveal problems while you can still fix them and operational levers that directly impact cash flow, net income, and overall financial health.
The challenge most finance leaders face isn’t understanding these metrics—it’s maintaining them at healthy levels as transaction volumes grow and business operations become more complex. Manual credit monitoring, collections follow-up, and cash application can’t scale efficiently, which is why credit and risk metrics often deteriorate during growth phases precisely when financial stability matters most.
Automation through platforms like Kolleno solves this by handling the repetitive workflows that traditionally limited how well finance teams could manage these key performance indicators, delivering measurable improvements in DSO, bad debt ratios, CEI, and working capital without adding headcount.Ready to see how automation improves your credit and risk metrics? Book a demo with Kolleno and discover which levers will move your financial performance most.